|
Download Data (XLS File) |
|
|||||
|
|||||
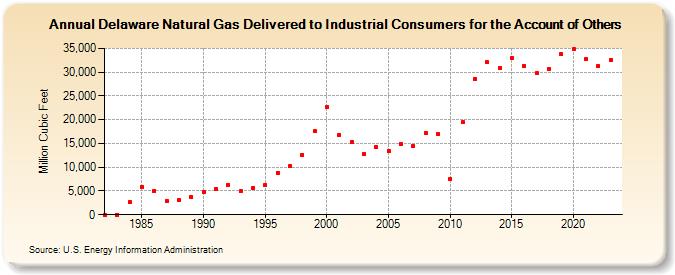
| Delaware Natural Gas Delivered to Industrial Consumers for the Account of Others (Million Cubic Feet) | |||||
| Decade | Year-0 | Year-1 | Year-2 | Year-3 | Year-4 | Year-5 | Year-6 | Year-7 | Year-8 | Year-9 |
|---|---|---|---|---|---|---|---|---|---|---|
| 1980's | 0 | 0 | 2,698 | 5,921 | 5,068 | 2,954 | 3,089 | 3,682 | ||
| 1990's | 4,847 | 5,509 | 6,316 | 4,922 | 5,631 | 6,281 | 8,882 | 10,223 | 12,633 | 17,567 |
| 2000's | 22,638 | 16,831 | 15,272 | 12,810 | 14,149 | 13,394 | 14,919 | 14,449 | 17,158 | 17,034 |
| 2010's | 7,560 | 19,436 | 28,644 | 32,057 | 30,899 | 33,028 | 31,377 | 29,759 | 30,671 | 33,751 |
| 2020's | 34,789 | 32,753 | 31,286 | 32,565 | 29,047 |
| - = No Data Reported; -- = Not Applicable; NA = Not Available; W = Withheld to avoid disclosure of individual company data. |
| Release Date: 6/30/2026 |
| Next Release Date: 7/31/2026 |