|
Download Data (XLS File) |
|
|||||
|
|||||
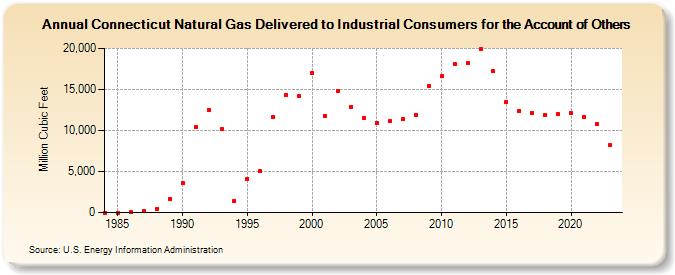
| Connecticut Natural Gas Delivered to Industrial Consumers for the Account of Others (Million Cubic Feet) | |||||
| Decade | Year-0 | Year-1 | Year-2 | Year-3 | Year-4 | Year-5 | Year-6 | Year-7 | Year-8 | Year-9 |
|---|---|---|---|---|---|---|---|---|---|---|
| 1980's | 0 | 0 | 12 | 137 | 453 | 1,681 | ||||
| 1990's | 3,572 | 10,370 | 12,514 | 10,164 | 1,435 | 4,130 | 5,008 | 11,597 | 14,359 | 14,156 |
| 2000's | 16,956 | 11,781 | 14,844 | 12,877 | 11,498 | 10,969 | 11,152 | 11,387 | 11,883 | 15,371 |
| 2010's | 16,605 | 18,120 | 18,233 | 19,949 | 17,200 | 13,489 | 12,383 | 12,174 | 11,833 | 11,975 |
| 2020's | 12,069 | 11,622 | 10,830 | 8,233 | 8,580 |
| - = No Data Reported; -- = Not Applicable; NA = Not Available; W = Withheld to avoid disclosure of individual company data. |
| Release Date: 6/30/2026 |
| Next Release Date: 7/31/2026 |