|
Download Data (XLS File) |
|
|||||
|
|||||
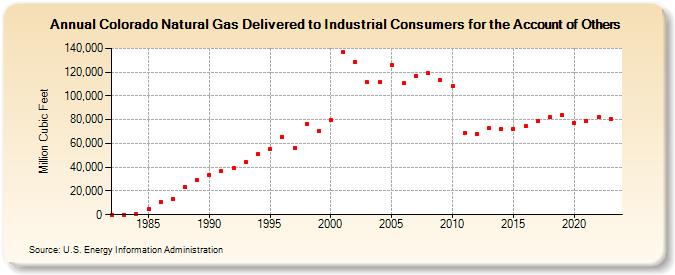
| Colorado Natural Gas Delivered to Industrial Consumers for the Account of Others (Million Cubic Feet) | |||||
| Decade | Year-0 | Year-1 | Year-2 | Year-3 | Year-4 | Year-5 | Year-6 | Year-7 | Year-8 | Year-9 |
|---|---|---|---|---|---|---|---|---|---|---|
| 1980's | 0 | 124 | 476 | 4,717 | 10,921 | 13,491 | 23,309 | 29,106 | ||
| 1990's | 33,799 | 36,685 | 39,040 | 44,465 | 51,292 | 55,143 | 65,641 | 56,338 | 76,652 | 70,344 |
| 2000's | 79,356 | 136,704 | 128,709 | 111,291 | 111,316 | 125,618 | 110,565 | 116,699 | 119,032 | 112,995 |
| 2010's | 108,317 | 68,813 | 68,042 | 72,659 | 72,330 | 72,170 | 74,391 | 78,838 | 82,120 | 84,137 |
| 2020's | 76,987 | 78,822 | 82,022 | 80,727 | 81,978 |
| - = No Data Reported; -- = Not Applicable; NA = Not Available; W = Withheld to avoid disclosure of individual company data. |
| Release Date: 6/30/2026 |
| Next Release Date: 7/31/2026 |