|
Download Data (XLS File) |
|
|||||
|
|||||
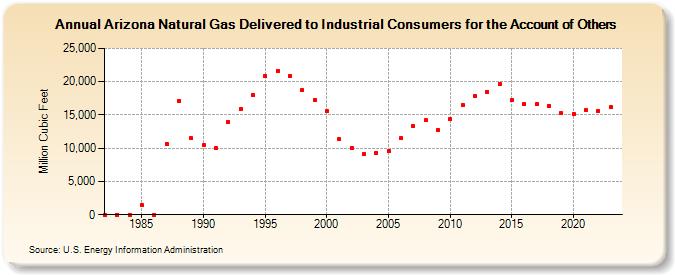
| Arizona Natural Gas Delivered to Industrial Consumers for the Account of Others (Million Cubic Feet) | |||||
| Decade | Year-0 | Year-1 | Year-2 | Year-3 | Year-4 | Year-5 | Year-6 | Year-7 | Year-8 | Year-9 |
|---|---|---|---|---|---|---|---|---|---|---|
| 1980's | 0 | 0 | 0 | 1,428 | 0 | 10,640 | 17,155 | 11,478 | ||
| 1990's | 10,421 | 9,966 | 13,925 | 15,868 | 18,035 | 20,825 | 21,670 | 20,873 | 18,740 | 17,238 |
| 2000's | 15,534 | 11,380 | 10,089 | 9,174 | 9,290 | 9,569 | 11,457 | 13,292 | 14,200 | 12,730 |
| 2010's | 14,343 | 16,469 | 17,800 | 18,486 | 19,612 | 17,185 | 16,628 | 16,584 | 16,411 | 15,239 |
| 2020's | 15,174 | 15,691 | 15,588 | 16,216 | 17,757 |
| - = No Data Reported; -- = Not Applicable; NA = Not Available; W = Withheld to avoid disclosure of individual company data. |
| Release Date: 6/30/2026 |
| Next Release Date: 7/31/2026 |