|
Download Data (XLS File) |
|
|||||
|
|||||
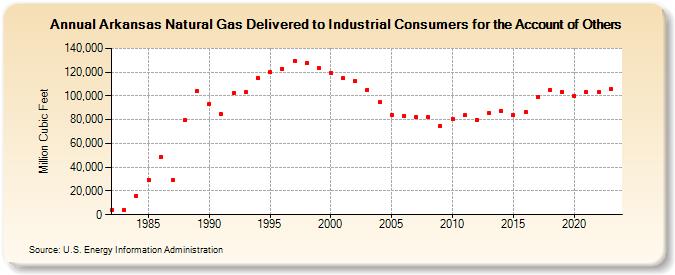
| Arkansas Natural Gas Delivered to Industrial Consumers for the Account of Others (Million Cubic Feet) | |||||
| Decade | Year-0 | Year-1 | Year-2 | Year-3 | Year-4 | Year-5 | Year-6 | Year-7 | Year-8 | Year-9 |
|---|---|---|---|---|---|---|---|---|---|---|
| 1980's | 4,177 | 3,778 | 15,960 | 29,546 | 48,694 | 29,024 | 79,343 | 104,237 | ||
| 1990's | 93,332 | 84,515 | 102,468 | 102,902 | 115,461 | 119,716 | 122,937 | 129,379 | 127,614 | 123,436 |
| 2000's | 119,594 | 114,976 | 112,544 | 105,215 | 94,613 | 84,177 | 83,347 | 82,213 | 81,841 | 74,752 |
| 2010's | 80,722 | 83,671 | 80,090 | 85,595 | 87,179 | 83,837 | 86,599 | 98,839 | 105,097 | 103,589 |
| 2020's | 100,048 | 103,312 | 103,099 | 105,619 | 105,059 |
| - = No Data Reported; -- = Not Applicable; NA = Not Available; W = Withheld to avoid disclosure of individual company data. |
| Release Date: 6/30/2026 |
| Next Release Date: 7/31/2026 |