|
Download Data (XLS File) |
|
|||||
|
|||||
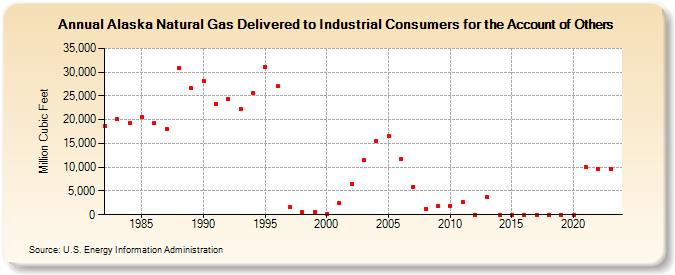
| Alaska Natural Gas Delivered to Industrial Consumers for the Account of Others (Million Cubic Feet) | |||||
| Decade | Year-0 | Year-1 | Year-2 | Year-3 | Year-4 | Year-5 | Year-6 | Year-7 | Year-8 | Year-9 |
|---|---|---|---|---|---|---|---|---|---|---|
| 1980's | 18,753 | 20,131 | 19,293 | 20,493 | 19,257 | 18,100 | 30,824 | 26,605 | ||
| 1990's | 28,165 | 23,363 | 24,455 | 22,258 | 25,523 | 31,112 | 27,026 | 1,609 | 473 | 661 |
| 2000's | 150 | 2,539 | 6,411 | 11,433 | 15,472 | 16,582 | 11,619 | 5,934 | 1,304 | 1,827 |
| 2010's | 1,893 | 2,657 | 0 | 3,698 | 0 | 0 | 0 | 0 | 0 | 0 |
| 2020's | 0 | 10,032 | 9,613 | 9,686 | 9,734 |
| - = No Data Reported; -- = Not Applicable; NA = Not Available; W = Withheld to avoid disclosure of individual company data. |
| Release Date: 6/30/2026 |
| Next Release Date: 7/31/2026 |