|
Download Data (XLS File) |
|
|||||
|
|||||
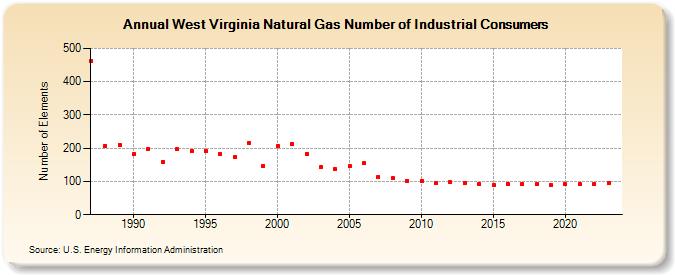
| West Virginia Natural Gas Number of Industrial Consumers (Number of Elements) | |||||
| Decade | Year-0 | Year-1 | Year-2 | Year-3 | Year-4 | Year-5 | Year-6 | Year-7 | Year-8 | Year-9 |
|---|---|---|---|---|---|---|---|---|---|---|
| 1980's | 463 | 208 | 211 | |||||||
| 1990's | 182 | 198 | 159 | 197 | 191 | 192 | 182 | 173 | 217 | 147 |
| 2000's | 207 | 213 | 184 | 142 | 137 | 145 | 155 | 114 | 109 | 101 |
| 2010's | 102 | 94 | 97 | 95 | 92 | 90 | 93 | 92 | 91 | 89 |
| 2020's | 91 | 91 | 92 | 96 | 91 |
| - = No Data Reported; -- = Not Applicable; NA = Not Available; W = Withheld to avoid disclosure of individual company data. |
| Release Date: 6/30/2026 |
| Next Release Date: 7/31/2026 |