|
Download Data (XLS File) |
|
|||||
|
|||||
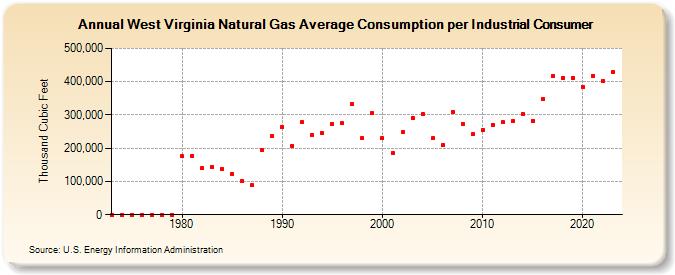
| West Virginia Natural Gas Average Consumption per Industrial Consumer (Thousand Cubic Feet) | |||||
| Decade | Year-0 | Year-1 | Year-2 | Year-3 | Year-4 | Year-5 | Year-6 | Year-7 | Year-8 | Year-9 |
|---|---|---|---|---|---|---|---|---|---|---|
| 1970's | 0 | 0 | 0 | 0 | 0 | 0 | 0 | |||
| 1980's | 175,434 | 177,420 | 139,757 | 143,854 | 138,629 | 123,772 | 101,695 | 89,030 | 194,301 | 236,096 |
| 1990's | 263,697 | 206,509 | 277,850 | 239,399 | 244,891 | 272,080 | 274,709 | 331,674 | 229,525 | 305,153 |
| 2000's | 229,943 | 185,908 | 247,238 | 291,022 | 301,519 | 229,402 | 208,218 | 309,665 | 273,181 | 241,901 |
| 2010's | 255,124 | 270,671 | 277,584 | 281,896 | 302,130 | 283,045 | 347,112 | 416,936 | 410,701 | 410,895 |
| 2020's | 384,066 | 417,680 | 402,329 | 428,454 | 475,037 |
| - = No Data Reported; -- = Not Applicable; NA = Not Available; W = Withheld to avoid disclosure of individual company data. |
| Release Date: 6/30/2026 |
| Next Release Date: 7/31/2026 |