|
Download Data (XLS File) |
|
|||||
|
|||||
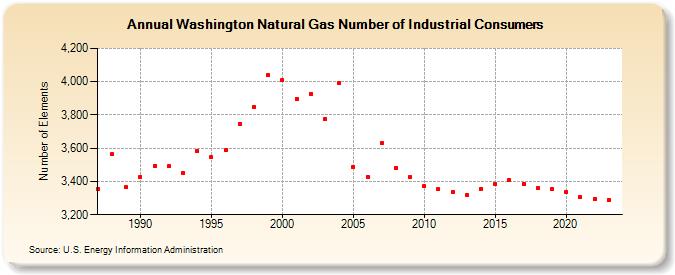
| Washington Natural Gas Number of Industrial Consumers (Number of Elements) | |||||
| Decade | Year-0 | Year-1 | Year-2 | Year-3 | Year-4 | Year-5 | Year-6 | Year-7 | Year-8 | Year-9 |
|---|---|---|---|---|---|---|---|---|---|---|
| 1980's | 3,355 | 3,564 | 3,365 | |||||||
| 1990's | 3,428 | 3,495 | 3,490 | 3,448 | 3,586 | 3,544 | 3,587 | 3,748 | 3,848 | 4,040 |
| 2000's | 4,007 | 3,898 | 3,928 | 3,775 | 3,992 | 3,489 | 3,428 | 3,630 | 3,483 | 3,428 |
| 2010's | 3,372 | 3,353 | 3,338 | 3,320 | 3,355 | 3,385 | 3,410 | 3,385 | 3,358 | 3,355 |
| 2020's | 3,337 | 3,306 | 3,296 | 3,290 | 3,282 |
| - = No Data Reported; -- = Not Applicable; NA = Not Available; W = Withheld to avoid disclosure of individual company data. |
| Release Date: 6/30/2026 |
| Next Release Date: 7/31/2026 |