|
Download Data (XLS File) |
|
|||||
|
|||||
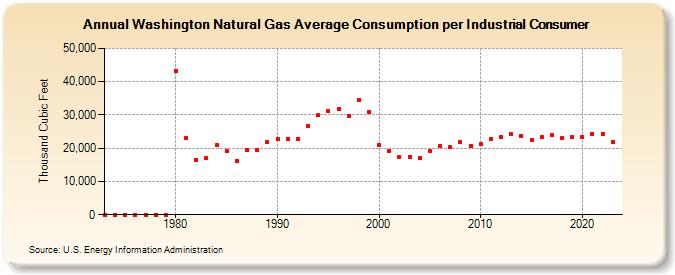
| Washington Natural Gas Average Consumption per Industrial Consumer (Thousand Cubic Feet) | |||||
| Decade | Year-0 | Year-1 | Year-2 | Year-3 | Year-4 | Year-5 | Year-6 | Year-7 | Year-8 | Year-9 |
|---|---|---|---|---|---|---|---|---|---|---|
| 1970's | 0 | 0 | 0 | 0 | 0 | 0 | 0 | |||
| 1980's | 43,142 | 23,180 | 16,597 | 16,961 | 20,885 | 19,144 | 16,224 | 19,585 | 19,478 | 21,765 |
| 1990's | 22,878 | 22,814 | 22,856 | 26,762 | 30,007 | 31,037 | 31,847 | 29,658 | 34,591 | 30,785 |
| 2000's | 20,900 | 19,245 | 17,240 | 17,453 | 16,987 | 19,167 | 20,641 | 20,268 | 21,748 | 20,791 |
| 2010's | 21,139 | 22,752 | 23,426 | 24,364 | 23,678 | 22,608 | 23,248 | 23,828 | 23,021 | 23,395 |
| 2020's | 23,413 | 24,413 | 24,284 | 21,930 | 23,838 |
| - = No Data Reported; -- = Not Applicable; NA = Not Available; W = Withheld to avoid disclosure of individual company data. |
| Release Date: 6/30/2026 |
| Next Release Date: 7/31/2026 |