|
Download Data (XLS File) |
|
|||||
|
|||||
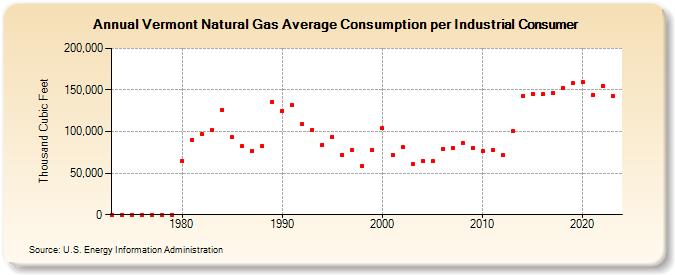
| Vermont Natural Gas Average Consumption per Industrial Consumer (Thousand Cubic Feet) | |||||
| Decade | Year-0 | Year-1 | Year-2 | Year-3 | Year-4 | Year-5 | Year-6 | Year-7 | Year-8 | Year-9 |
|---|---|---|---|---|---|---|---|---|---|---|
| 1970's | 0 | 0 | 0 | 0 | 0 | 0 | 0 | |||
| 1980's | 64,880 | 89,957 | 96,726 | 101,324 | 126,504 | 93,350 | 82,295 | 76,567 | 82,920 | 135,779 |
| 1990's | 125,194 | 132,070 | 108,751 | 102,255 | 84,307 | 93,854 | 72,327 | 77,807 | 58,461 | 78,396 |
| 2000's | 103,922 | 72,128 | 81,182 | 60,468 | 64,734 | 64,086 | 78,921 | 80,721 | 85,724 | 80,290 |
| 2010's | 76,566 | 78,119 | 71,345 | 100,226 | 142,919 | 145,737 | 144,771 | 146,065 | 152,291 | 157,993 |
| 2020's | 159,110 | 144,170 | 154,987 | 142,460 | 147,223 |
| - = No Data Reported; -- = Not Applicable; NA = Not Available; W = Withheld to avoid disclosure of individual company data. |
| Release Date: 6/30/2026 |
| Next Release Date: 7/31/2026 |