|
Download Data (XLS File) |
|
|||||
|
|||||
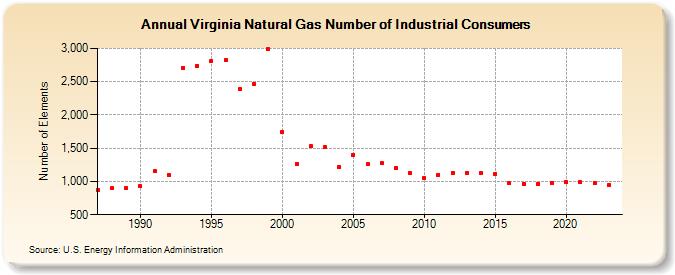
| Virginia Natural Gas Number of Industrial Consumers (Number of Elements) | |||||
| Decade | Year-0 | Year-1 | Year-2 | Year-3 | Year-4 | Year-5 | Year-6 | Year-7 | Year-8 | Year-9 |
|---|---|---|---|---|---|---|---|---|---|---|
| 1980's | 877 | 895 | 895 | |||||||
| 1990's | 929 | 1,156 | 1,101 | 2,706 | 2,740 | 2,812 | 2,822 | 2,391 | 2,469 | 2,984 |
| 2000's | 1,749 | 1,261 | 1,526 | 1,517 | 1,217 | 1,402 | 1,256 | 1,271 | 1,205 | 1,126 |
| 2010's | 1,059 | 1,103 | 1,132 | 1,132 | 1,123 | 1,118 | 972 | 968 | 966 | 978 |
| 2020's | 989 | 989 | 981 | 943 | 951 |
| - = No Data Reported; -- = Not Applicable; NA = Not Available; W = Withheld to avoid disclosure of individual company data. |
| Release Date: 6/30/2026 |
| Next Release Date: 7/31/2026 |