|
Download Data (XLS File) |
|
|||||
|
|||||
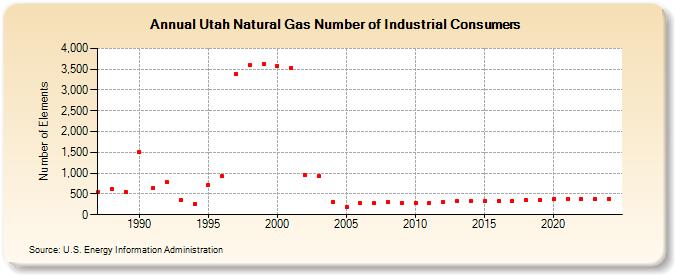
| Utah Natural Gas Number of Industrial Consumers (Number of Elements) | |||||
| Decade | Year-0 | Year-1 | Year-2 | Year-3 | Year-4 | Year-5 | Year-6 | Year-7 | Year-8 | Year-9 |
|---|---|---|---|---|---|---|---|---|---|---|
| 1980's | 551 | 627 | 550 | |||||||
| 1990's | 1,508 | 631 | 783 | 345 | 252 | 713 | 923 | 3,379 | 3,597 | 3,625 |
| 2000's | 3,576 | 3,535 | 949 | 924 | 312 | 191 | 274 | 278 | 313 | 293 |
| 2010's | 293 | 286 | 302 | 323 | 326 | 320 | 322 | 334 | 350 | 363 |
| 2020's | 369 | 375 | 376 | 382 | 385 |
| - = No Data Reported; -- = Not Applicable; NA = Not Available; W = Withheld to avoid disclosure of individual company data. |
| Release Date: 6/30/2026 |
| Next Release Date: 7/31/2026 |