|
Download Data (XLS File) |
|
|||||
|
|||||
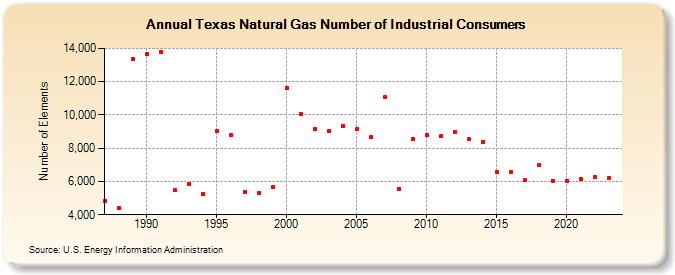
| Texas Natural Gas Number of Industrial Consumers (Number of Elements) | |||||
| Decade | Year-0 | Year-1 | Year-2 | Year-3 | Year-4 | Year-5 | Year-6 | Year-7 | Year-8 | Year-9 |
|---|---|---|---|---|---|---|---|---|---|---|
| 1980's | 4,852 | 4,427 | 13,383 | |||||||
| 1990's | 13,659 | 13,770 | 5,481 | 5,823 | 5,222 | 9,043 | 8,796 | 5,339 | 5,318 | 5,655 |
| 2000's | 11,613 | 10,047 | 9,143 | 9,015 | 9,359 | 9,136 | 8,664 | 11,063 | 5,568 | 8,581 |
| 2010's | 8,779 | 8,713 | 8,953 | 8,525 | 8,398 | 6,545 | 6,548 | 6,059 | 6,967 | 6,019 |
| 2020's | 6,036 | 6,142 | 6,262 | 6,062 | 6,718 |
| - = No Data Reported; -- = Not Applicable; NA = Not Available; W = Withheld to avoid disclosure of individual company data. |
| Release Date: 6/30/2026 |
| Next Release Date: 7/31/2026 |