|
Download Data (XLS File) |
|
|||||
|
|||||
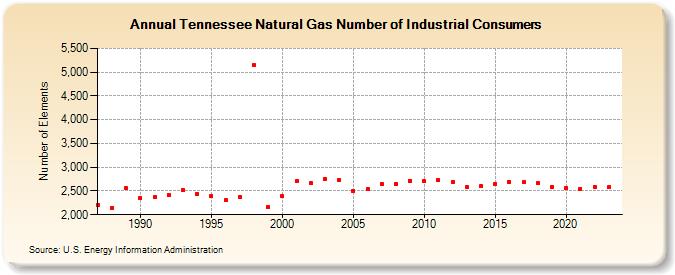
| Tennessee Natural Gas Number of Industrial Consumers (Number of Elements) | |||||
| Decade | Year-0 | Year-1 | Year-2 | Year-3 | Year-4 | Year-5 | Year-6 | Year-7 | Year-8 | Year-9 |
|---|---|---|---|---|---|---|---|---|---|---|
| 1980's | 2,206 | 2,151 | 2,555 | |||||||
| 1990's | 2,361 | 2,369 | 2,425 | 2,512 | 2,440 | 2,393 | 2,306 | 2,382 | 5,149 | 2,159 |
| 2000's | 2,386 | 2,704 | 2,657 | 2,755 | 2,738 | 2,498 | 2,545 | 2,656 | 2,650 | 2,717 |
| 2010's | 2,702 | 2,729 | 2,679 | 2,581 | 2,595 | 2,653 | 2,685 | 2,681 | 2,665 | 2,588 |
| 2020's | 2,571 | 2,550 | 2,587 | 2,575 | 2,553 |
| - = No Data Reported; -- = Not Applicable; NA = Not Available; W = Withheld to avoid disclosure of individual company data. |
| Release Date: 6/30/2026 |
| Next Release Date: 7/31/2026 |