|
Download Data (XLS File) |
|
|||||
|
|||||
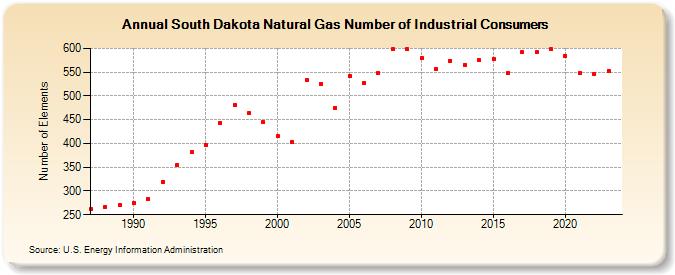
| South Dakota Natural Gas Number of Industrial Consumers (Number of Elements) | |||||
| Decade | Year-0 | Year-1 | Year-2 | Year-3 | Year-4 | Year-5 | Year-6 | Year-7 | Year-8 | Year-9 |
|---|---|---|---|---|---|---|---|---|---|---|
| 1980's | 261 | 267 | 270 | |||||||
| 1990's | 275 | 283 | 319 | 355 | 381 | 396 | 444 | 481 | 464 | 445 |
| 2000's | 416 | 402 | 533 | 526 | 475 | 542 | 528 | 548 | 598 | 598 |
| 2010's | 580 | 556 | 574 | 566 | 575 | 578 | 548 | 592 | 592 | 598 |
| 2020's | 585 | 548 | 546 | 553 | 564 |
| - = No Data Reported; -- = Not Applicable; NA = Not Available; W = Withheld to avoid disclosure of individual company data. |
| Release Date: 6/30/2026 |
| Next Release Date: 7/31/2026 |