|
Download Data (XLS File) |
|
|||||
|
|||||
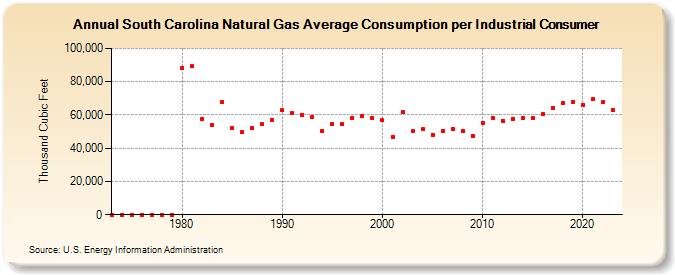
| South Carolina Natural Gas Average Consumption per Industrial Consumer (Thousand Cubic Feet) | |||||
| Decade | Year-0 | Year-1 | Year-2 | Year-3 | Year-4 | Year-5 | Year-6 | Year-7 | Year-8 | Year-9 |
|---|---|---|---|---|---|---|---|---|---|---|
| 1970's | 0 | 0 | 0 | 0 | 0 | 0 | 0 | |||
| 1980's | 88,420 | 89,236 | 57,782 | 54,063 | 67,707 | 51,883 | 49,680 | 52,023 | 54,342 | 57,027 |
| 1990's | 62,739 | 61,279 | 60,158 | 58,804 | 50,571 | 54,568 | 54,288 | 58,350 | 59,215 | 58,051 |
| 2000's | 56,732 | 46,812 | 61,592 | 50,068 | 51,323 | 48,210 | 50,504 | 51,825 | 50,438 | 47,610 |
| 2010's | 55,394 | 57,918 | 56,561 | 57,665 | 57,866 | 58,269 | 60,499 | 64,249 | 67,143 | 67,790 |
| 2020's | 66,257 | 69,833 | 67,611 | 62,800 | 63,378 |
| - = No Data Reported; -- = Not Applicable; NA = Not Available; W = Withheld to avoid disclosure of individual company data. |
| Release Date: 6/30/2026 |
| Next Release Date: 7/31/2026 |