|
Download Data (XLS File) |
|
|||||
|
|||||
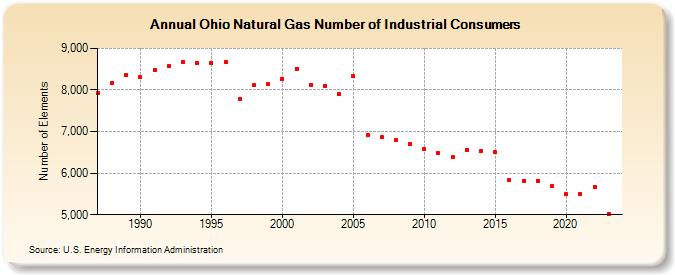
| Ohio Natural Gas Number of Industrial Consumers (Number of Elements) | |||||
| Decade | Year-0 | Year-1 | Year-2 | Year-3 | Year-4 | Year-5 | Year-6 | Year-7 | Year-8 | Year-9 |
|---|---|---|---|---|---|---|---|---|---|---|
| 1980's | 7,929 | 8,163 | 8,356 | |||||||
| 1990's | 8,301 | 8,479 | 8,573 | 8,678 | 8,655 | 8,650 | 8,672 | 7,779 | 8,112 | 8,136 |
| 2000's | 8,267 | 8,515 | 8,111 | 8,098 | 7,899 | 8,328 | 6,929 | 6,858 | 6,806 | 6,712 |
| 2010's | 6,571 | 6,482 | 6,381 | 6,554 | 6,526 | 6,502 | 5,838 | 5,817 | 5,820 | 5,696 |
| 2020's | 5,495 | 5,488 | 5,672 | 5,014 | 6,223 |
| - = No Data Reported; -- = Not Applicable; NA = Not Available; W = Withheld to avoid disclosure of individual company data. |
| Release Date: 6/30/2026 |
| Next Release Date: 7/31/2026 |