|
Download Data (XLS File) |
|
|||||
|
|||||
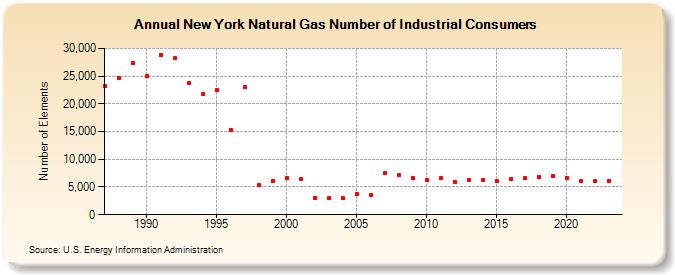
| New York Natural Gas Number of Industrial Consumers (Number of Elements) | |||||
| Decade | Year-0 | Year-1 | Year-2 | Year-3 | Year-4 | Year-5 | Year-6 | Year-7 | Year-8 | Year-9 |
|---|---|---|---|---|---|---|---|---|---|---|
| 1980's | 23,276 | 24,654 | 27,426 | |||||||
| 1990's | 25,008 | 28,837 | 28,198 | 23,833 | 21,833 | 22,484 | 15,300 | 23,099 | 5,294 | 6,136 |
| 2000's | 6,553 | 6,501 | 3,068 | 2,984 | 2,963 | 3,752 | 3,642 | 7,484 | 7,080 | 6,634 |
| 2010's | 6,236 | 6,609 | 5,910 | 6,311 | 6,313 | 6,031 | 6,466 | 6,650 | 6,867 | 7,049 |
| 2020's | 6,663 | 6,044 | 6,090 | 6,104 | 6,092 |
| - = No Data Reported; -- = Not Applicable; NA = Not Available; W = Withheld to avoid disclosure of individual company data. |
| Release Date: 6/30/2026 |
| Next Release Date: 7/31/2026 |