|
Download Data (XLS File) |
|
|||||
|
|||||
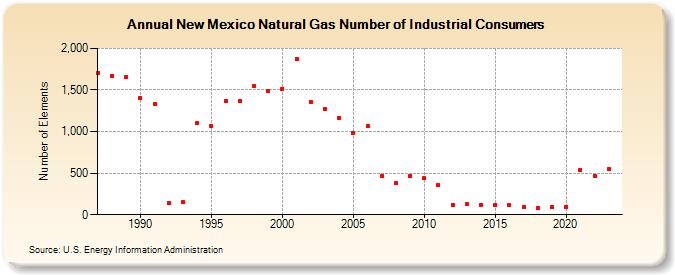
| New Mexico Natural Gas Number of Industrial Consumers (Number of Elements) | |||||
| Decade | Year-0 | Year-1 | Year-2 | Year-3 | Year-4 | Year-5 | Year-6 | Year-7 | Year-8 | Year-9 |
|---|---|---|---|---|---|---|---|---|---|---|
| 1980's | 1,703 | 1,668 | 1,653 | |||||||
| 1990's | 1,407 | 1,337 | 141 | 152 | 1,097 | 1,065 | 1,365 | 1,366 | 1,549 | 1,482 |
| 2000's | 1,517 | 1,875 | 1,356 | 1,270 | 1,164 | 988 | 1,062 | 470 | 383 | 471 |
| 2010's | 438 | 360 | 121 | 123 | 118 | 116 | 111 | 92 | 82 | 91 |
| 2020's | 98 | 540 | 470 | 552 | 545 |
| - = No Data Reported; -- = Not Applicable; NA = Not Available; W = Withheld to avoid disclosure of individual company data. |
| Release Date: 6/30/2026 |
| Next Release Date: 7/31/2026 |