|
Download Data (XLS File) |
|
|||||
|
|||||
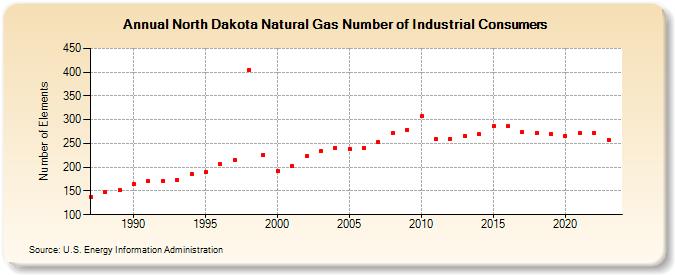
| North Dakota Natural Gas Number of Industrial Consumers (Number of Elements) | |||||
| Decade | Year-0 | Year-1 | Year-2 | Year-3 | Year-4 | Year-5 | Year-6 | Year-7 | Year-8 | Year-9 |
|---|---|---|---|---|---|---|---|---|---|---|
| 1980's | 138 | 148 | 151 | |||||||
| 1990's | 165 | 170 | 171 | 174 | 186 | 189 | 206 | 216 | 404 | 226 |
| 2000's | 192 | 203 | 223 | 234 | 241 | 239 | 241 | 253 | 271 | 279 |
| 2010's | 307 | 259 | 260 | 266 | 269 | 286 | 286 | 274 | 272 | 270 |
| 2020's | 266 | 271 | 273 | 258 | 250 |
| - = No Data Reported; -- = Not Applicable; NA = Not Available; W = Withheld to avoid disclosure of individual company data. |
| Release Date: 6/30/2026 |
| Next Release Date: 7/31/2026 |