|
Download Data (XLS File) |
|
|||||
|
|||||
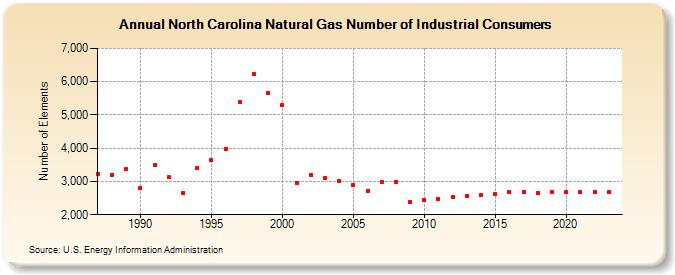
| North Carolina Natural Gas Number of Industrial Consumers (Number of Elements) | |||||
| Decade | Year-0 | Year-1 | Year-2 | Year-3 | Year-4 | Year-5 | Year-6 | Year-7 | Year-8 | Year-9 |
|---|---|---|---|---|---|---|---|---|---|---|
| 1980's | 3,236 | 3,196 | 3,381 | |||||||
| 1990's | 2,802 | 3,506 | 3,119 | 2,664 | 3,401 | 3,652 | 3,973 | 5,375 | 6,228 | 5,672 |
| 2000's | 5,288 | 2,962 | 3,200 | 3,101 | 3,021 | 2,891 | 2,701 | 2,991 | 2,984 | 2,384 |
| 2010's | 2,457 | 2,468 | 2,525 | 2,567 | 2,596 | 2,624 | 2,668 | 2,687 | 2,666 | 2,681 |
| 2020's | 2,691 | 2,672 | 2,681 | 2,669 | 2,678 |
| - = No Data Reported; -- = Not Applicable; NA = Not Available; W = Withheld to avoid disclosure of individual company data. |
| Release Date: 6/30/2026 |
| Next Release Date: 7/31/2026 |