|
Download Data (XLS File) |
|
|||||
|
|||||
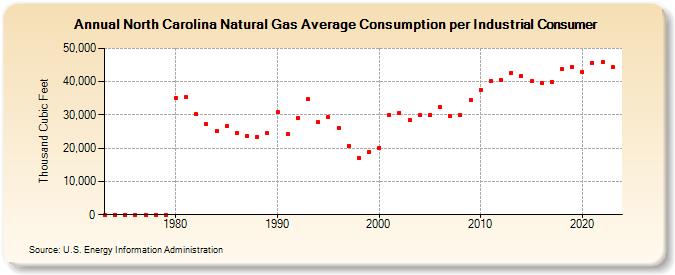
| North Carolina Natural Gas Average Consumption per Industrial Consumer (Thousand Cubic Feet) | |||||
| Decade | Year-0 | Year-1 | Year-2 | Year-3 | Year-4 | Year-5 | Year-6 | Year-7 | Year-8 | Year-9 |
|---|---|---|---|---|---|---|---|---|---|---|
| 1970's | 0 | 0 | 0 | 0 | 0 | 0 | 0 | |||
| 1980's | 35,159 | 35,277 | 30,229 | 27,311 | 25,046 | 26,584 | 24,435 | 23,617 | 23,427 | 24,439 |
| 1990's | 30,758 | 24,205 | 29,171 | 34,650 | 27,885 | 29,225 | 26,208 | 20,747 | 17,100 | 18,915 |
| 2000's | 20,149 | 29,995 | 30,720 | 28,522 | 29,835 | 30,032 | 32,266 | 29,556 | 29,932 | 34,502 |
| 2010's | 37,575 | 40,158 | 40,456 | 42,720 | 41,565 | 40,054 | 39,544 | 39,960 | 43,802 | 44,429 |
| 2020's | 42,864 | 45,745 | 45,826 | 44,303 | 44,051 |
| - = No Data Reported; -- = Not Applicable; NA = Not Available; W = Withheld to avoid disclosure of individual company data. |
| Release Date: 6/30/2026 |
| Next Release Date: 7/31/2026 |