|
Download Data (XLS File) |
|
|||||
|
|||||
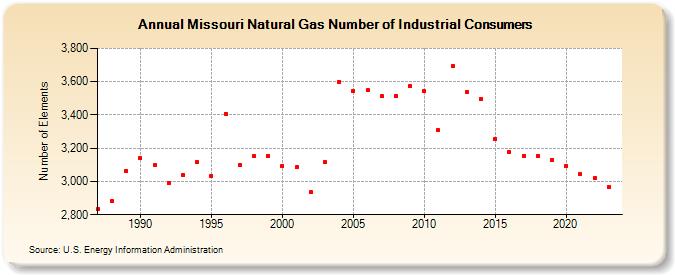
| Missouri Natural Gas Number of Industrial Consumers (Number of Elements) | |||||
| Decade | Year-0 | Year-1 | Year-2 | Year-3 | Year-4 | Year-5 | Year-6 | Year-7 | Year-8 | Year-9 |
|---|---|---|---|---|---|---|---|---|---|---|
| 1980's | 2,832 | 2,880 | 3,063 | |||||||
| 1990's | 3,140 | 3,096 | 2,989 | 3,040 | 3,115 | 3,033 | 3,408 | 3,097 | 3,151 | 3,152 |
| 2000's | 3,094 | 3,085 | 2,935 | 3,115 | 3,600 | 3,545 | 3,548 | 3,511 | 3,514 | 3,573 |
| 2010's | 3,541 | 3,307 | 3,692 | 3,538 | 3,497 | 3,256 | 3,177 | 3,154 | 3,155 | 3,130 |
| 2020's | 3,093 | 3,042 | 3,020 | 2,968 | 2,969 |
| - = No Data Reported; -- = Not Applicable; NA = Not Available; W = Withheld to avoid disclosure of individual company data. |
| Release Date: 6/30/2026 |
| Next Release Date: 7/31/2026 |