|
Download Data (XLS File) |
|
|||||
|
|||||
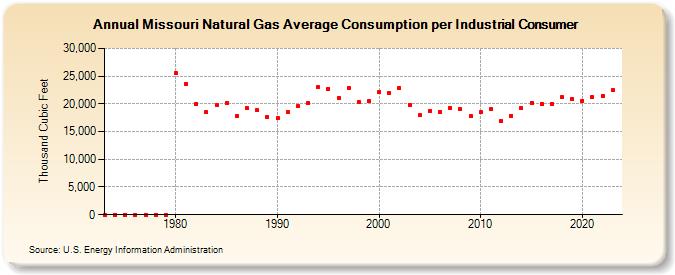
| Missouri Natural Gas Average Consumption per Industrial Consumer (Thousand Cubic Feet) | |||||
| Decade | Year-0 | Year-1 | Year-2 | Year-3 | Year-4 | Year-5 | Year-6 | Year-7 | Year-8 | Year-9 |
|---|---|---|---|---|---|---|---|---|---|---|
| 1970's | 0 | 0 | 0 | 0 | 0 | 0 | 0 | |||
| 1980's | 25,527 | 23,662 | 19,963 | 18,493 | 19,822 | 20,116 | 17,801 | 19,183 | 18,834 | 17,610 |
| 1990's | 17,369 | 18,471 | 19,560 | 20,060 | 22,986 | 22,725 | 20,990 | 22,882 | 20,401 | 20,432 |
| 2000's | 22,138 | 21,992 | 22,816 | 19,758 | 17,912 | 18,717 | 18,497 | 19,330 | 18,998 | 17,753 |
| 2010's | 18,513 | 19,067 | 16,933 | 17,866 | 19,192 | 20,175 | 20,028 | 20,025 | 21,155 | 20,911 |
| 2020's | 20,574 | 21,165 | 21,481 | 22,406 | 22,901 |
| - = No Data Reported; -- = Not Applicable; NA = Not Available; W = Withheld to avoid disclosure of individual company data. |
| Release Date: 6/30/2026 |
| Next Release Date: 7/31/2026 |