|
Download Data (XLS File) |
|
|||||
|
|||||
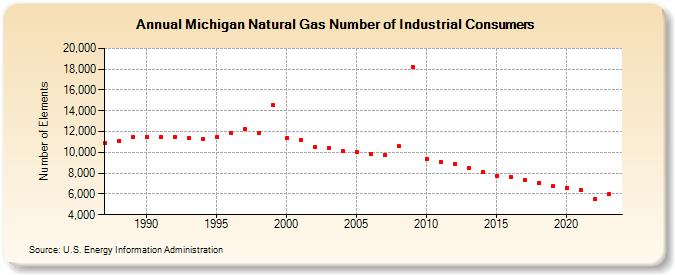
| Michigan Natural Gas Number of Industrial Consumers (Number of Elements) | |||||
| Decade | Year-0 | Year-1 | Year-2 | Year-3 | Year-4 | Year-5 | Year-6 | Year-7 | Year-8 | Year-9 |
|---|---|---|---|---|---|---|---|---|---|---|
| 1980's | 10,885 | 11,117 | 11,452 | |||||||
| 1990's | 11,500 | 11,446 | 11,460 | 11,425 | 11,308 | 11,454 | 11,848 | 12,233 | 11,888 | 14,527 |
| 2000's | 11,384 | 11,210 | 10,468 | 10,378 | 10,088 | 10,049 | 9,885 | 9,728 | 10,563 | 18,186 |
| 2010's | 9,332 | 9,088 | 8,833 | 8,497 | 8,156 | 7,761 | 7,652 | 7,325 | 7,076 | 6,729 |
| 2020's | 6,589 | 6,392 | 5,491 | 5,979 | 5,830 |
| - = No Data Reported; -- = Not Applicable; NA = Not Available; W = Withheld to avoid disclosure of individual company data. |
| Release Date: 6/30/2026 |
| Next Release Date: 7/31/2026 |