|
Download Data (XLS File) |
|
|||||
|
|||||
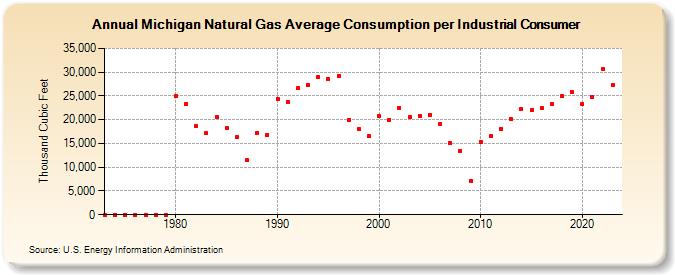
| Michigan Natural Gas Average Consumption per Industrial Consumer (Thousand Cubic Feet) | |||||
| Decade | Year-0 | Year-1 | Year-2 | Year-3 | Year-4 | Year-5 | Year-6 | Year-7 | Year-8 | Year-9 |
|---|---|---|---|---|---|---|---|---|---|---|
| 1970's | 0 | 0 | 0 | 0 | 0 | 0 | 0 | |||
| 1980's | 24,968 | 23,397 | 18,592 | 17,102 | 20,549 | 18,339 | 16,299 | 11,444 | 17,195 | 16,851 |
| 1990's | 24,401 | 23,763 | 26,651 | 27,313 | 28,993 | 28,510 | 29,291 | 19,892 | 18,097 | 16,479 |
| 2000's | 20,821 | 19,969 | 22,558 | 20,548 | 20,867 | 21,051 | 19,070 | 15,068 | 13,366 | 7,066 |
| 2010's | 15,361 | 16,624 | 17,954 | 20,105 | 22,171 | 22,058 | 22,479 | 23,234 | 24,908 | 25,801 |
| 2020's | 23,395 | 24,820 | 30,578 | 27,280 | 26,378 |
| - = No Data Reported; -- = Not Applicable; NA = Not Available; W = Withheld to avoid disclosure of individual company data. |
| Release Date: 6/30/2026 |
| Next Release Date: 7/31/2026 |