|
Download Data (XLS File) |
|
|||||
|
|||||
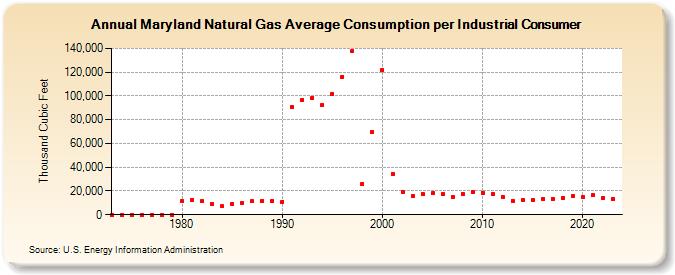
| Maryland Natural Gas Average Consumption per Industrial Consumer (Thousand Cubic Feet) | |||||
| Decade | Year-0 | Year-1 | Year-2 | Year-3 | Year-4 | Year-5 | Year-6 | Year-7 | Year-8 | Year-9 |
|---|---|---|---|---|---|---|---|---|---|---|
| 1970's | 0 | 0 | 0 | 0 | 0 | 0 | 0 | |||
| 1980's | 11,907 | 12,667 | 11,404 | 9,175 | 7,037 | 9,314 | 10,241 | 11,194 | 11,894 | 11,898 |
| 1990's | 10,954 | 90,673 | 96,731 | 98,472 | 92,425 | 101,794 | 116,331 | 137,690 | 26,176 | 69,427 |
| 2000's | 121,786 | 34,481 | 18,956 | 16,039 | 17,253 | 17,941 | 17,176 | 15,313 | 17,267 | 19,389 |
| 2010's | 18,623 | 17,308 | 15,156 | 11,926 | 12,497 | 12,630 | 13,253 | 13,631 | 14,061 | 15,986 |
| 2020's | 14,514 | 16,450 | 14,127 | 13,104 | 13,268 |
| - = No Data Reported; -- = Not Applicable; NA = Not Available; W = Withheld to avoid disclosure of individual company data. |
| Release Date: 6/30/2026 |
| Next Release Date: 7/31/2026 |