|
Download Data (XLS File) |
|
|||||
|
|||||
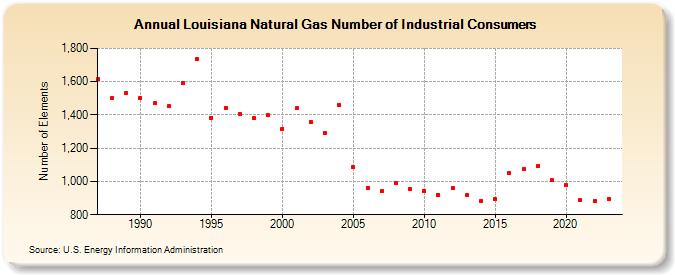
| Louisiana Natural Gas Number of Industrial Consumers (Number of Elements) | |||||
| Decade | Year-0 | Year-1 | Year-2 | Year-3 | Year-4 | Year-5 | Year-6 | Year-7 | Year-8 | Year-9 |
|---|---|---|---|---|---|---|---|---|---|---|
| 1980's | 1,617 | 1,503 | 1,531 | |||||||
| 1990's | 1,504 | 1,469 | 1,452 | 1,592 | 1,737 | 1,383 | 1,444 | 1,406 | 1,380 | 1,397 |
| 2000's | 1,318 | 1,440 | 1,357 | 1,291 | 1,460 | 1,086 | 962 | 945 | 988 | 954 |
| 2010's | 942 | 920 | 963 | 916 | 883 | 893 | 1,052 | 1,072 | 1,094 | 1,007 |
| 2020's | 976 | 888 | 881 | 912 | 926 |
| - = No Data Reported; -- = Not Applicable; NA = Not Available; W = Withheld to avoid disclosure of individual company data. |
| Release Date: 6/30/2026 |
| Next Release Date: 7/31/2026 |