|
Download Data (XLS File) |
|
|||||
|
|||||
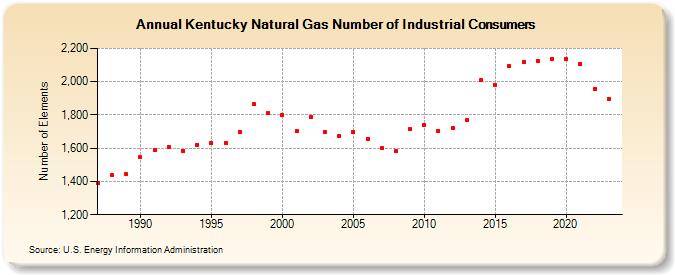
| Kentucky Natural Gas Number of Industrial Consumers (Number of Elements) | |||||
| Decade | Year-0 | Year-1 | Year-2 | Year-3 | Year-4 | Year-5 | Year-6 | Year-7 | Year-8 | Year-9 |
|---|---|---|---|---|---|---|---|---|---|---|
| 1980's | 1,391 | 1,436 | 1,443 | |||||||
| 1990's | 1,544 | 1,587 | 1,608 | 1,585 | 1,621 | 1,630 | 1,633 | 1,698 | 1,864 | 1,813 |
| 2000's | 1,801 | 1,701 | 1,785 | 1,695 | 1,672 | 1,698 | 1,658 | 1,599 | 1,585 | 1,715 |
| 2010's | 1,742 | 1,705 | 1,720 | 1,767 | 2,008 | 1,980 | 2,092 | 2,121 | 2,123 | 2,137 |
| 2020's | 2,139 | 2,109 | 1,957 | 1,894 | 1,897 |
| - = No Data Reported; -- = Not Applicable; NA = Not Available; W = Withheld to avoid disclosure of individual company data. |
| Release Date: 6/30/2026 |
| Next Release Date: 7/31/2026 |