|
Download Data (XLS File) |
|
|||||
|
|||||
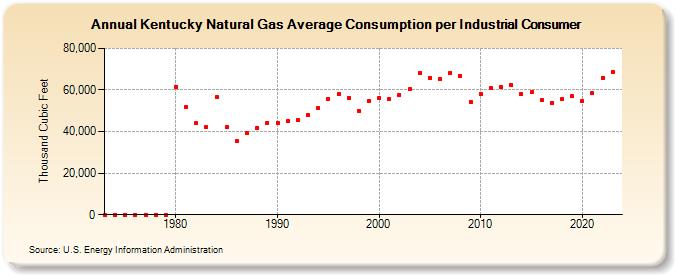
| Kentucky Natural Gas Average Consumption per Industrial Consumer (Thousand Cubic Feet) | |||||
| Decade | Year-0 | Year-1 | Year-2 | Year-3 | Year-4 | Year-5 | Year-6 | Year-7 | Year-8 | Year-9 |
|---|---|---|---|---|---|---|---|---|---|---|
| 1970's | 0 | 0 | 0 | 0 | 0 | 0 | 0 | |||
| 1980's | 61,665 | 51,828 | 43,953 | 41,996 | 56,517 | 41,999 | 35,384 | 39,202 | 41,877 | 44,354 |
| 1990's | 44,305 | 45,140 | 45,783 | 47,962 | 51,253 | 55,683 | 57,857 | 56,375 | 50,009 | 54,468 |
| 2000's | 56,219 | 55,789 | 57,766 | 60,337 | 68,356 | 65,963 | 65,195 | 68,319 | 66,911 | 54,437 |
| 2010's | 58,265 | 60,713 | 61,369 | 62,399 | 58,090 | 58,850 | 55,067 | 53,551 | 55,559 | 56,934 |
| 2020's | 54,595 | 58,489 | 65,907 | 68,599 | 70,943 |
| - = No Data Reported; -- = Not Applicable; NA = Not Available; W = Withheld to avoid disclosure of individual company data. |
| Release Date: 6/30/2026 |
| Next Release Date: 7/31/2026 |