|
Download Data (XLS File) |
|
|||||
|
|||||
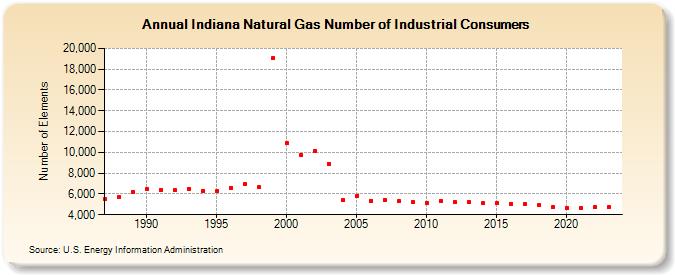
| Indiana Natural Gas Number of Industrial Consumers (Number of Elements) | |||||
| Decade | Year-0 | Year-1 | Year-2 | Year-3 | Year-4 | Year-5 | Year-6 | Year-7 | Year-8 | Year-9 |
|---|---|---|---|---|---|---|---|---|---|---|
| 1980's | 5,497 | 5,696 | 6,196 | |||||||
| 1990's | 6,439 | 6,393 | 6,358 | 6,508 | 6,314 | 6,250 | 6,586 | 6,920 | 6,635 | 19,069 |
| 2000's | 10,866 | 9,778 | 10,139 | 8,913 | 5,368 | 5,823 | 5,350 | 5,427 | 5,294 | 5,190 |
| 2010's | 5,145 | 5,338 | 5,204 | 5,178 | 5,098 | 5,095 | 5,064 | 5,015 | 4,904 | 4,716 |
| 2020's | 4,693 | 4,684 | 4,695 | 4,719 | 4,665 |
| - = No Data Reported; -- = Not Applicable; NA = Not Available; W = Withheld to avoid disclosure of individual company data. |
| Release Date: 6/30/2026 |
| Next Release Date: 7/31/2026 |