|
Download Data (XLS File) |
|
|||||
|
|||||
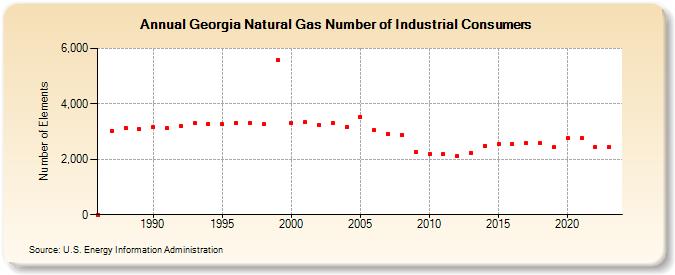
| Georgia Natural Gas Number of Industrial Consumers (Number of Elements) | |||||
| Decade | Year-0 | Year-1 | Year-2 | Year-3 | Year-4 | Year-5 | Year-6 | Year-7 | Year-8 | Year-9 |
|---|---|---|---|---|---|---|---|---|---|---|
| 1980's | 3 | 3,034 | 3,144 | 3,079 | ||||||
| 1990's | 3,153 | 3,124 | 3,186 | 3,302 | 3,277 | 3,261 | 3,310 | 3,310 | 3,262 | 5,580 |
| 2000's | 3,294 | 3,330 | 3,219 | 3,326 | 3,161 | 3,543 | 3,053 | 2,913 | 2,890 | 2,254 |
| 2010's | 2,174 | 2,184 | 2,112 | 2,242 | 2,481 | 2,549 | 2,542 | 2,577 | 2,575 | 2,432 |
| 2020's | 2,763 | 2,772 | 2,450 | 2,432 | 2,433 |
| - = No Data Reported; -- = Not Applicable; NA = Not Available; W = Withheld to avoid disclosure of individual company data. |
| Release Date: 6/30/2026 |
| Next Release Date: 7/31/2026 |