|
Download Data (XLS File) |
|
|||||
|
|||||
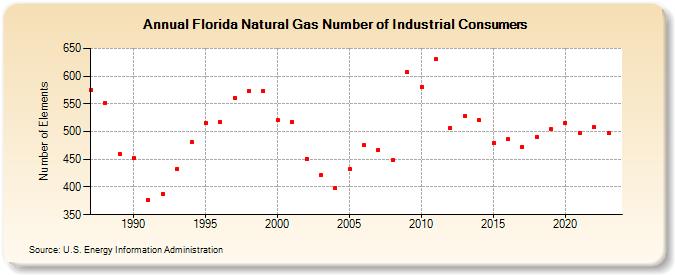
| Florida Natural Gas Number of Industrial Consumers (Number of Elements) | |||||
| Decade | Year-0 | Year-1 | Year-2 | Year-3 | Year-4 | Year-5 | Year-6 | Year-7 | Year-8 | Year-9 |
|---|---|---|---|---|---|---|---|---|---|---|
| 1980's | 575 | 552 | 460 | |||||||
| 1990's | 452 | 377 | 388 | 433 | 481 | 515 | 517 | 561 | 574 | 573 |
| 2000's | 520 | 518 | 451 | 421 | 398 | 432 | 475 | 467 | 449 | 607 |
| 2010's | 581 | 630 | 507 | 528 | 520 | 479 | 486 | 473 | 491 | 504 |
| 2020's | 515 | 498 | 508 | 497 | 434 |
| - = No Data Reported; -- = Not Applicable; NA = Not Available; W = Withheld to avoid disclosure of individual company data. |
| Release Date: 6/30/2026 |
| Next Release Date: 7/31/2026 |