|
Download Data (XLS File) |
|
|||||
|
|||||
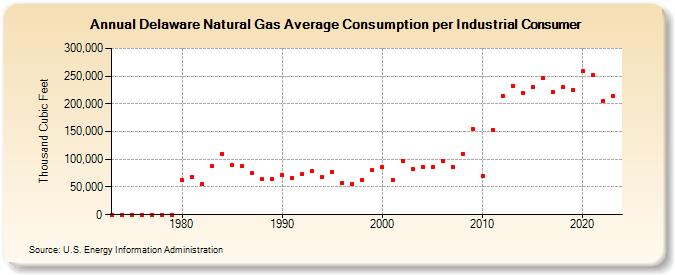
| Delaware Natural Gas Average Consumption per Industrial Consumer (Thousand Cubic Feet) | |||||
| Decade | Year-0 | Year-1 | Year-2 | Year-3 | Year-4 | Year-5 | Year-6 | Year-7 | Year-8 | Year-9 |
|---|---|---|---|---|---|---|---|---|---|---|
| 1970's | 0 | 0 | 0 | 0 | 0 | 0 | 0 | |||
| 1980's | 61,966 | 68,737 | 55,597 | 87,081 | 110,111 | 90,377 | 87,539 | 74,846 | 63,532 | 64,430 |
| 1990's | 70,984 | 66,449 | 72,823 | 78,126 | 68,319 | 76,678 | 56,657 | 55,870 | 63,375 | 79,828 |
| 2000's | 85,270 | 63,479 | 96,890 | 82,455 | 86,157 | 85,233 | 96,461 | 86,562 | 110,399 | 155,373 |
| 2010's | 70,023 | 153,175 | 214,453 | 232,997 | 219,885 | 230,041 | 245,756 | 221,187 | 229,727 | 224,271 |
| 2020's | 258,486 | 252,507 | 205,014 | 214,789 | 180,836 |
| - = No Data Reported; -- = Not Applicable; NA = Not Available; W = Withheld to avoid disclosure of individual company data. |
| Release Date: 6/30/2026 |
| Next Release Date: 7/31/2026 |