|
Download Data (XLS File) |
|
|||||
|
|||||
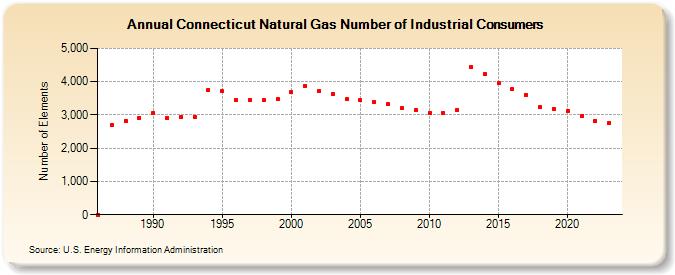
| Connecticut Natural Gas Number of Industrial Consumers (Number of Elements) | |||||
| Decade | Year-0 | Year-1 | Year-2 | Year-3 | Year-4 | Year-5 | Year-6 | Year-7 | Year-8 | Year-9 |
|---|---|---|---|---|---|---|---|---|---|---|
| 1980's | 2 | 2,709 | 2,818 | 2,908 | ||||||
| 1990's | 3,061 | 2,921 | 2,923 | 2,952 | 3,754 | 3,705 | 3,435 | 3,459 | 3,441 | 3,465 |
| 2000's | 3,683 | 3,881 | 3,716 | 3,625 | 3,470 | 3,437 | 3,393 | 3,317 | 3,196 | 3,138 |
| 2010's | 3,063 | 3,062 | 3,148 | 4,454 | 4,217 | 3,945 | 3,776 | 3,599 | 3,235 | 3,181 |
| 2020's | 3,111 | 2,964 | 2,822 | 2,769 | 2,655 |
| - = No Data Reported; -- = Not Applicable; NA = Not Available; W = Withheld to avoid disclosure of individual company data. |
| Release Date: 6/30/2026 |
| Next Release Date: 7/31/2026 |