|
Download Data (XLS File) |
|
|||||
|
|||||
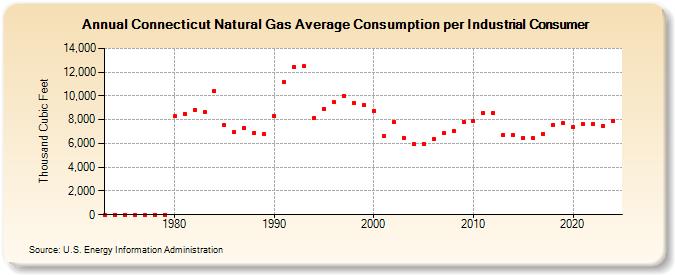
| Connecticut Natural Gas Average Consumption per Industrial Consumer (Thousand Cubic Feet) | |||||
| Decade | Year-0 | Year-1 | Year-2 | Year-3 | Year-4 | Year-5 | Year-6 | Year-7 | Year-8 | Year-9 |
|---|---|---|---|---|---|---|---|---|---|---|
| 1970's | 0 | 0 | 0 | 0 | 0 | 0 | 0 | |||
| 1980's | 8,306 | 8,516 | 8,847 | 8,681 | 10,428 | 7,572 | 6,961 | 7,310 | 6,897 | 6,783 |
| 1990's | 8,314 | 11,181 | 12,447 | 12,480 | 8,164 | 8,935 | 9,447 | 9,990 | 9,444 | 9,246 |
| 2000's | 8,733 | 6,602 | 7,818 | 6,497 | 5,916 | 5,955 | 6,387 | 6,872 | 7,052 | 7,835 |
| 2010's | 7,874 | 8,576 | 8,555 | 6,728 | 6,728 | 6,492 | 6,428 | 6,823 | 7,593 | 7,708 |
| 2020's | 7,399 | 7,608 | 7,668 | 7,458 | 7,907 |
| - = No Data Reported; -- = Not Applicable; NA = Not Available; W = Withheld to avoid disclosure of individual company data. |
| Release Date: 6/30/2026 |
| Next Release Date: 7/31/2026 |