|
Download Data (XLS File) |
|
|||||
|
|||||
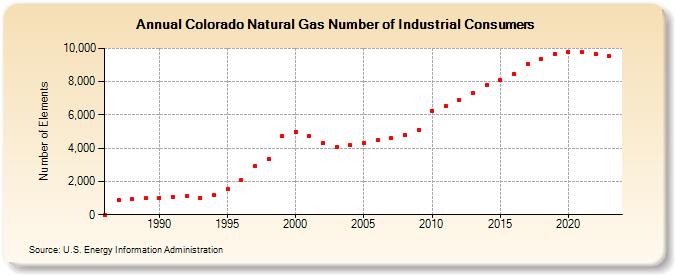
| Colorado Natural Gas Number of Industrial Consumers (Number of Elements) | |||||
| Decade | Year-0 | Year-1 | Year-2 | Year-3 | Year-4 | Year-5 | Year-6 | Year-7 | Year-8 | Year-9 |
|---|---|---|---|---|---|---|---|---|---|---|
| 1980's | 1 | 896 | 923 | 976 | ||||||
| 1990's | 1,018 | 1,074 | 1,108 | 1,032 | 1,176 | 1,528 | 2,099 | 2,923 | 3,349 | 4,727 |
| 2000's | 4,994 | 4,729 | 4,337 | 4,054 | 4,175 | 4,318 | 4,472 | 4,592 | 4,816 | 5,084 |
| 2010's | 6,232 | 6,529 | 6,906 | 7,293 | 7,823 | 8,094 | 8,484 | 9,074 | 9,366 | 9,656 |
| 2020's | 9,753 | 9,786 | 9,683 | 9,537 | 9,374 |
| - = No Data Reported; -- = Not Applicable; NA = Not Available; W = Withheld to avoid disclosure of individual company data. |
| Release Date: 6/30/2026 |
| Next Release Date: 7/31/2026 |