|
Download Data (XLS File) |
|
|||||
|
|||||
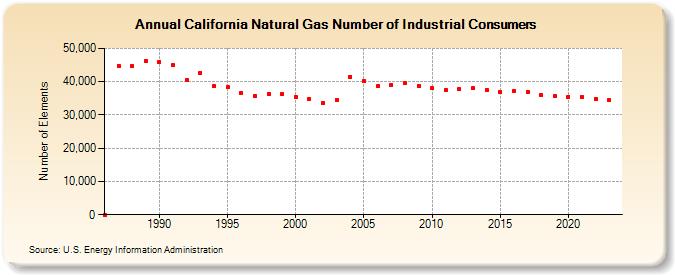
| California Natural Gas Number of Industrial Consumers (Number of Elements) | |||||
| Decade | Year-0 | Year-1 | Year-2 | Year-3 | Year-4 | Year-5 | Year-6 | Year-7 | Year-8 | Year-9 |
|---|---|---|---|---|---|---|---|---|---|---|
| 1980's | 31 | 44,764 | 44,680 | 46,243 | ||||||
| 1990's | 46,048 | 44,865 | 40,528 | 42,748 | 38,750 | 38,457 | 36,613 | 35,830 | 36,235 | 36,435 |
| 2000's | 35,391 | 34,893 | 33,725 | 34,617 | 41,487 | 40,226 | 38,637 | 39,134 | 39,591 | 38,746 |
| 2010's | 38,006 | 37,575 | 37,686 | 37,996 | 37,548 | 36,853 | 37,242 | 36,833 | 36,060 | 35,625 |
| 2020's | 35,517 | 35,498 | 34,860 | 34,393 | 33,610 |
| - = No Data Reported; -- = Not Applicable; NA = Not Available; W = Withheld to avoid disclosure of individual company data. |
| Release Date: 6/30/2026 |
| Next Release Date: 7/31/2026 |