|
Download Data (XLS File) |
|
|||||
|
|||||
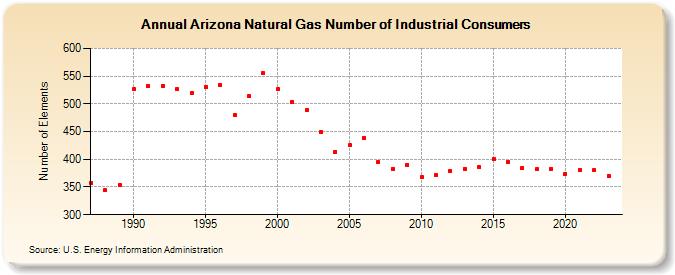
| Arizona Natural Gas Number of Industrial Consumers (Number of Elements) | |||||
| Decade | Year-0 | Year-1 | Year-2 | Year-3 | Year-4 | Year-5 | Year-6 | Year-7 | Year-8 | Year-9 |
|---|---|---|---|---|---|---|---|---|---|---|
| 1980's | 358 | 344 | 354 | |||||||
| 1990's | 526 | 532 | 532 | 526 | 519 | 530 | 534 | 480 | 514 | 555 |
| 2000's | 526 | 504 | 488 | 450 | 414 | 425 | 439 | 395 | 383 | 390 |
| 2010's | 368 | 371 | 379 | 383 | 386 | 400 | 395 | 385 | 382 | 383 |
| 2020's | 374 | 381 | 380 | 370 | 373 |
| - = No Data Reported; -- = Not Applicable; NA = Not Available; W = Withheld to avoid disclosure of individual company data. |
| Release Date: 6/30/2026 |
| Next Release Date: 7/31/2026 |