|
Download Data (XLS File) |
|
|||||
|
|||||
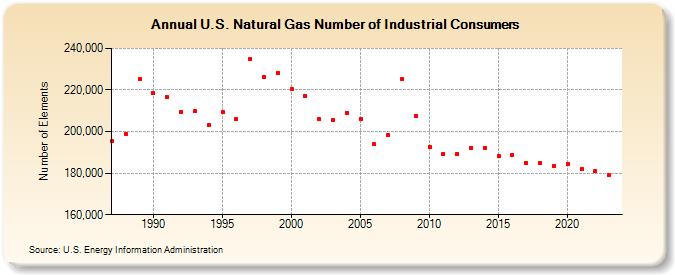
| U.S. Natural Gas Number of Industrial Consumers (Number of Elements) | |||||
| Decade | Year-0 | Year-1 | Year-2 | Year-3 | Year-4 | Year-5 | Year-6 | Year-7 | Year-8 | Year-9 |
|---|---|---|---|---|---|---|---|---|---|---|
| 1980's | 195,544 | 199,041 | 225,346 | |||||||
| 1990's | 218,341 | 216,529 | 209,616 | 209,666 | 202,940 | 209,398 | 206,049 | 234,855 | 226,191 | 228,331 |
| 2000's | 220,251 | 217,026 | 205,915 | 205,514 | 209,058 | 206,223 | 193,830 | 198,289 | 225,044 | 207,624 |
| 2010's | 192,730 | 189,301 | 189,372 | 192,288 | 192,139 | 188,336 | 188,836 | 184,959 | 185,009 | 183,507 |
| 2020's | 184,466 | 182,207 | 181,002 | 178,477 | 177,803 |
| - = No Data Reported; -- = Not Applicable; NA = Not Available; W = Withheld to avoid disclosure of individual company data. |
| Release Date: 6/30/2026 |
| Next Release Date: 7/31/2026 |