|
Download Data (XLS File) |
|
|||||
|
|||||
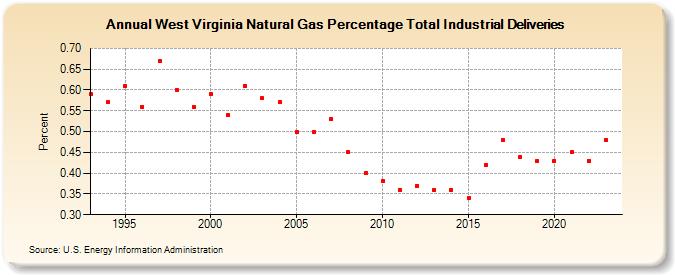
| West Virginia Natural Gas Percentage Total Industrial Deliveries (Percent) | |||||
| Decade | Year-0 | Year-1 | Year-2 | Year-3 | Year-4 | Year-5 | Year-6 | Year-7 | Year-8 | Year-9 |
|---|---|---|---|---|---|---|---|---|---|---|
| 1990's | 0.59 | 0.57 | 0.61 | 0.56 | 0.67 | 0.60 | 0.56 | |||
| 2000's | 0.59 | 0.54 | 0.61 | 0.58 | 0.57 | 0.50 | 0.50 | 0.53 | 0.45 | 0.40 |
| 2010's | 0.38 | 0.36 | 0.37 | 0.36 | 0.36 | 0.34 | 0.42 | 0.48 | 0.44 | 0.43 |
| 2020's | 0.43 | 0.45 | 0.43 | 0.48 | 0.50 |
| - = No Data Reported; -- = Not Applicable; NA = Not Available; W = Withheld to avoid disclosure of individual company data. |
| Release Date: 5/29/2026 |
| Next Release Date: 6/30/2026 |