|
Download Data (XLS File) |
|
|||||
|
|||||
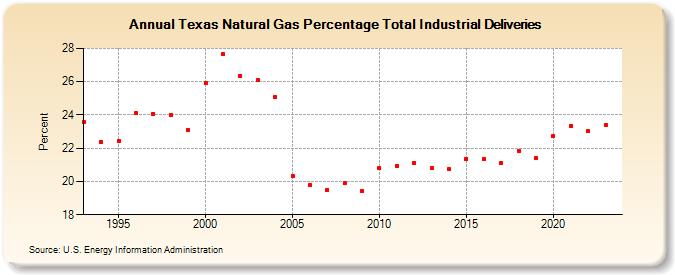
| Texas Natural Gas Percentage Total Industrial Deliveries (Percent) | |||||
| Decade | Year-0 | Year-1 | Year-2 | Year-3 | Year-4 | Year-5 | Year-6 | Year-7 | Year-8 | Year-9 |
|---|---|---|---|---|---|---|---|---|---|---|
| 1990's | 23.58 | 22.40 | 22.42 | 24.10 | 24.08 | 24.02 | 23.08 | |||
| 2000's | 25.92 | 27.64 | 26.35 | 26.10 | 25.05 | 20.33 | 19.79 | 19.49 | 19.89 | 19.43 |
| 2010's | 20.78 | 20.94 | 21.13 | 20.79 | 20.74 | 21.35 | 21.35 | 21.13 | 21.84 | 21.38 |
| 2020's | 22.72 | 23.36 | 23.01 | 23.39 | 23.70 |
| - = No Data Reported; -- = Not Applicable; NA = Not Available; W = Withheld to avoid disclosure of individual company data. |
| Release Date: 5/29/2026 |
| Next Release Date: 6/30/2026 |