|
Download Data (XLS File) |
|
|||||
|
|||||
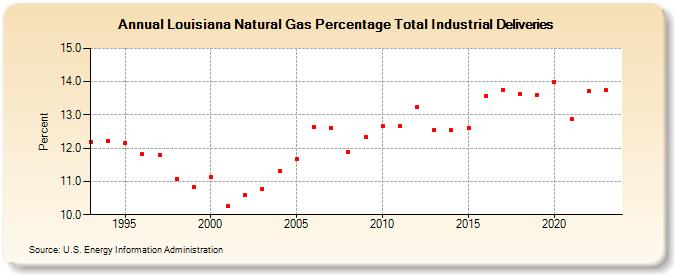
| Louisiana Natural Gas Percentage Total Industrial Deliveries (Percent) | |||||
| Decade | Year-0 | Year-1 | Year-2 | Year-3 | Year-4 | Year-5 | Year-6 | Year-7 | Year-8 | Year-9 |
|---|---|---|---|---|---|---|---|---|---|---|
| 1990's | 12.20 | 12.23 | 12.17 | 11.82 | 11.80 | 11.08 | 10.84 | |||
| 2000's | 11.13 | 10.25 | 10.59 | 10.77 | 11.31 | 11.67 | 12.64 | 12.61 | 11.88 | 12.35 |
| 2010's | 12.66 | 12.67 | 13.23 | 12.56 | 12.56 | 12.62 | 13.57 | 13.76 | 13.64 | 13.61 |
| 2020's | 14.00 | 12.88 | 13.73 | 13.76 | 13.84 |
| - = No Data Reported; -- = Not Applicable; NA = Not Available; W = Withheld to avoid disclosure of individual company data. |
| Release Date: 5/29/2026 |
| Next Release Date: 6/30/2026 |