|
Download Data (XLS File) |
|
|||||
|
|||||
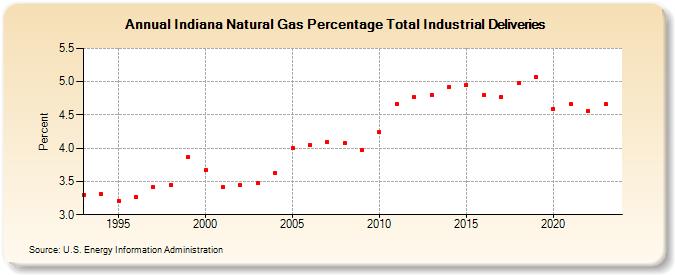
| Indiana Natural Gas Percentage Total Industrial Deliveries (Percent) | |||||
| Decade | Year-0 | Year-1 | Year-2 | Year-3 | Year-4 | Year-5 | Year-6 | Year-7 | Year-8 | Year-9 |
|---|---|---|---|---|---|---|---|---|---|---|
| 1990's | 3.30 | 3.31 | 3.21 | 3.26 | 3.41 | 3.45 | 3.86 | |||
| 2000's | 3.67 | 3.41 | 3.45 | 3.48 | 3.63 | 4.00 | 4.05 | 4.10 | 4.08 | 3.97 |
| 2010's | 4.24 | 4.67 | 4.77 | 4.80 | 4.92 | 4.95 | 4.80 | 4.77 | 4.98 | 5.07 |
| 2020's | 4.59 | 4.66 | 4.56 | 4.66 | 4.61 |
| - = No Data Reported; -- = Not Applicable; NA = Not Available; W = Withheld to avoid disclosure of individual company data. |
| Release Date: 5/29/2026 |
| Next Release Date: 6/30/2026 |