|
Download Data (XLS File) |
|
|||||
|
|||||
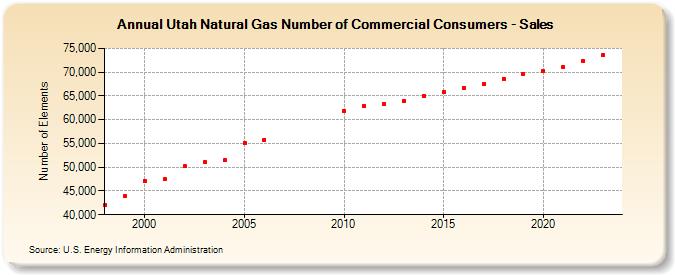
| Utah Natural Gas Number of Commercial Consumers - Sales (Number of Elements) | |||||
| Decade | Year-0 | Year-1 | Year-2 | Year-3 | Year-4 | Year-5 | Year-6 | Year-7 | Year-8 | Year-9 |
|---|---|---|---|---|---|---|---|---|---|---|
| 1990's | 42,026 | 43,833 | ||||||||
| 2000's | 47,163 | 47,433 | 50,168 | 51,026 | 51,422 | 55,144 | 55,794 | |||
| 2010's | 61,929 | 62,831 | 63,298 | 63,960 | 64,931 | 65,917 | 66,691 | 67,540 | 68,654 | 69,568 |
| 2020's | 70,257 | 71,164 | 72,290 | 73,593 | 74,555 |
| - = No Data Reported; -- = Not Applicable; NA = Not Available; W = Withheld to avoid disclosure of individual company data. |
| Release Date: 6/30/2026 |
| Next Release Date: 7/31/2026 |