|
Download Data (XLS File) |
|
|||||
|
|||||
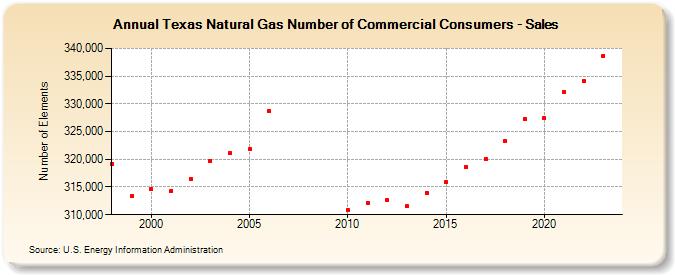
| Texas Natural Gas Number of Commercial Consumers - Sales (Number of Elements) | |||||
| Decade | Year-0 | Year-1 | Year-2 | Year-3 | Year-4 | Year-5 | Year-6 | Year-7 | Year-8 | Year-9 |
|---|---|---|---|---|---|---|---|---|---|---|
| 1990's | 319,179 | 313,372 | ||||||||
| 2000's | 314,604 | 314,321 | 316,514 | 319,736 | 321,172 | 321,838 | 328,706 | |||
| 2010's | 310,842 | 312,164 | 312,574 | 311,493 | 313,971 | 315,883 | 318,674 | 320,129 | 323,231 | 327,336 |
| 2020's | 327,436 | 332,055 | 334,120 | 338,315 | 338,353 |
| - = No Data Reported; -- = Not Applicable; NA = Not Available; W = Withheld to avoid disclosure of individual company data. |
| Release Date: 6/30/2026 |
| Next Release Date: 7/31/2026 |