|
Download Data (XLS File) |
|
|||||
|
|||||
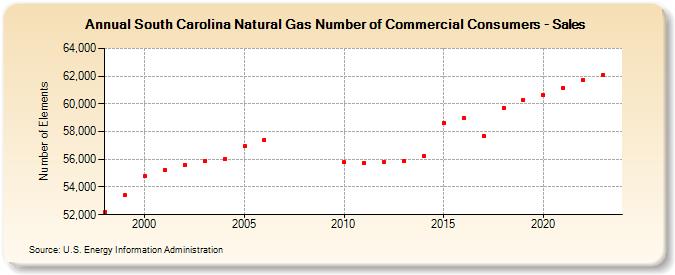
| South Carolina Natural Gas Number of Commercial Consumers - Sales (Number of Elements) | |||||
| Decade | Year-0 | Year-1 | Year-2 | Year-3 | Year-4 | Year-5 | Year-6 | Year-7 | Year-8 | Year-9 |
|---|---|---|---|---|---|---|---|---|---|---|
| 1990's | 52,190 | 53,391 | ||||||||
| 2000's | 54,793 | 55,256 | 55,603 | 55,872 | 56,003 | 56,936 | 57,410 | |||
| 2010's | 55,776 | 55,760 | 55,815 | 55,902 | 56,225 | 58,600 | 58,987 | 57,665 | 59,700 | 60,302 |
| 2020's | 60,639 | 61,172 | 61,753 | 62,094 | 63,089 |
| - = No Data Reported; -- = Not Applicable; NA = Not Available; W = Withheld to avoid disclosure of individual company data. |
| Release Date: 6/30/2026 |
| Next Release Date: 7/31/2026 |