|
Download Data (XLS File) |
|
|||||
|
|||||
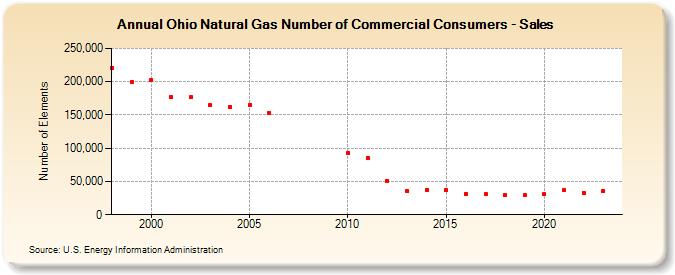
| Ohio Natural Gas Number of Commercial Consumers - Sales (Number of Elements) | |||||
| Decade | Year-0 | Year-1 | Year-2 | Year-3 | Year-4 | Year-5 | Year-6 | Year-7 | Year-8 | Year-9 |
|---|---|---|---|---|---|---|---|---|---|---|
| 1990's | 220,563 | 199,481 | ||||||||
| 2000's | 202,226 | 177,290 | 176,466 | 164,218 | 162,613 | 165,238 | 152,786 | |||
| 2010's | 92,621 | 85,877 | 51,308 | 35,966 | 37,035 | 36,612 | 31,526 | 30,551 | 29,856 | 30,008 |
| 2020's | 30,909 | 36,753 | 33,263 | 35,418 | 30,020 |
| - = No Data Reported; -- = Not Applicable; NA = Not Available; W = Withheld to avoid disclosure of individual company data. |
| Release Date: 6/30/2026 |
| Next Release Date: 7/31/2026 |