|
Download Data (XLS File) |
|
|||||
|
|||||
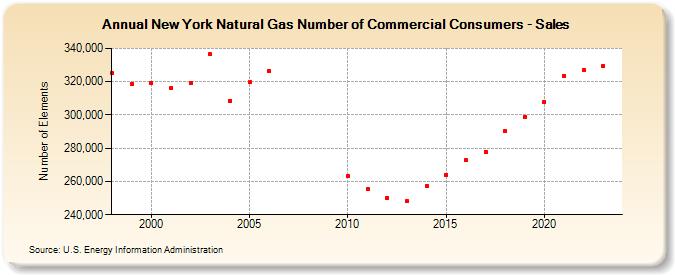
| New York Natural Gas Number of Commercial Consumers - Sales (Number of Elements) | |||||
| Decade | Year-0 | Year-1 | Year-2 | Year-3 | Year-4 | Year-5 | Year-6 | Year-7 | Year-8 | Year-9 |
|---|---|---|---|---|---|---|---|---|---|---|
| 1990's | 324,919 | 318,704 | ||||||||
| 2000's | 319,045 | 316,135 | 319,130 | 336,414 | 308,665 | 319,618 | 326,281 | |||
| 2010's | 263,352 | 255,460 | 250,101 | 247,946 | 257,375 | 264,176 | 272,840 | 277,882 | 290,045 | 298,987 |
| 2020's | 307,969 | 323,525 | 327,081 | 329,466 | 330,947 |
| - = No Data Reported; -- = Not Applicable; NA = Not Available; W = Withheld to avoid disclosure of individual company data. |
| Release Date: 6/30/2026 |
| Next Release Date: 7/31/2026 |